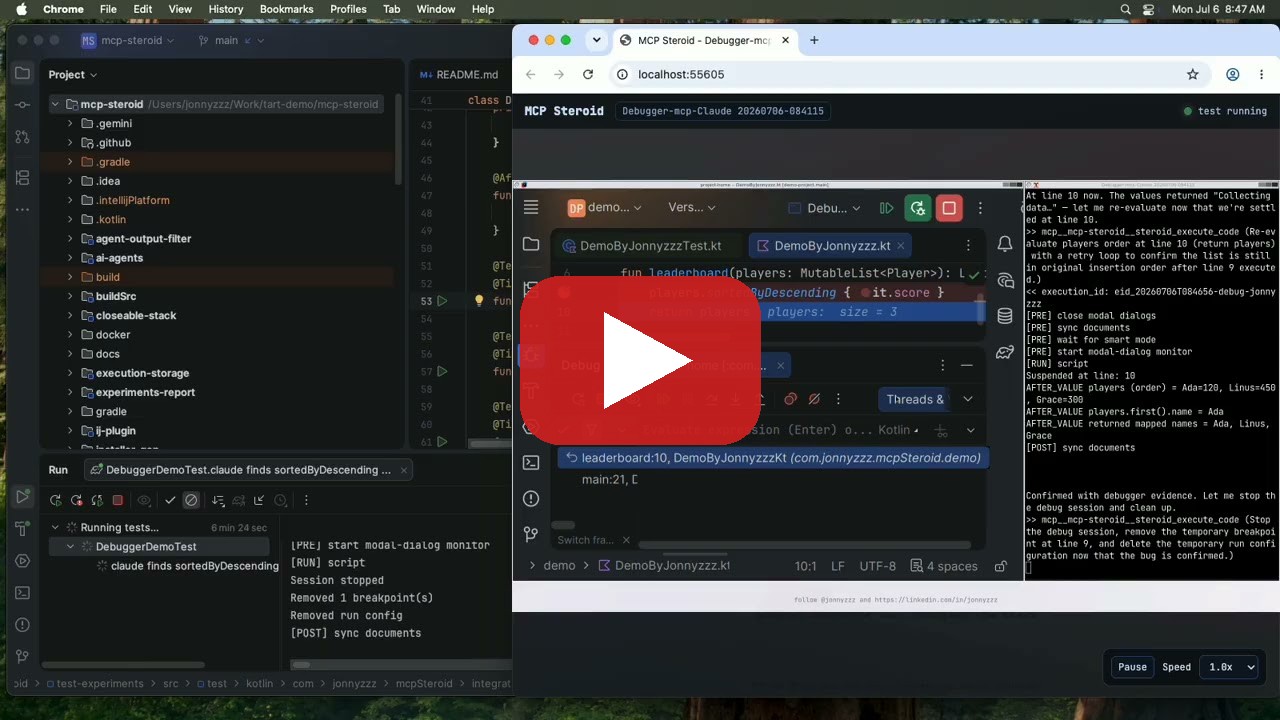
The demo: an integration test boots IntelliJ IDEA inside a Docker container, streams its live screen into the browser tab on the right, and a Claude agent drives the IDE debugger — all of it the setup described below. Watch it on YouTube.
The question I keep asking myself while writing my IntelliJ plugins – is there a way to write an integration test that proves the plugin actually works inside the IDE. You need tests 10x more thanks to AI Agents and agentic loops, and since I integrate deeply with the IDE, I need that even more. The integration tests are also the source of the Agentic traces I use to self-improve MCP Steroid.
In this post, I share insights to the setup of full integration tests with IntelliJ-based IDEs, running with GUI, inside Docker container.
It started about 8 years ago, when we first introduced performance tests into the IntelliJ platform — such tests are now visible under the IntelliJ Community. We’ve been using these tests to stabilize IntelliJ Shared Indexes. This time, I provide the fully reusable way to run integration tests, now in Docker and with full GUI and tools.
We walk through the essentials: the Docker image, the X server setup, how we keep IntelliJ manageable in there, and how the video reaches your browser. Enough details that you (better your AI Agent) can re-implement the approach for your own GUI-under-test — it is not IntelliJ-specific at all. All the code is open source in the test-integration module, and the tech powers the demo videos we are preparing for the project.
This continues the MCP Steroid series — the original post explains why AI Agents get the full IntelliJ runtime, and the devrig post covers the autonomous IDE lifecycle. Today is about the test infrastructure underneath.
Why not headless, why not mocks
First of all, you can find the testing framework in the IntelliJ SDK, that is great and enough for most of the cases. Here we discuss more high-level integration tests, which are as close to the end-user IDE as possible, with modal dialogs, and production files layout, production threading, deadlocks, and more.
The interesting bugs live in the seams: a modal dialog that blocks the whole IDE, the trust prompt that appears only on first open of a project, indexing that makes every PSI call return incomplete results or fail. MCP Steroid server executes Kotlin code inside the live IDE process — such the integration test has to prove that works while the IDE is doing all its usual IDE things.
Headless IntelliJ exists, but it is a different product in practice. No window subsystem means no dialogs, no
focus, no screenshots — and screenshots are an MCP Steroid feature (steroid_take_screenshot). If the agent
can see the IDE in production, the test environment must render actual pixels, and the IDE behaviour
should be tested appropriately. The headless IDE — the same
flavor the test framework uses — runs a different threading model that is much more convenient for testing.
For the reference, Remote Development functions slightly differently, we are not covering it.
I want to be certain my plugin and my features are behaving in the GUI version of the IDE, just like the end-users do.
The requirement list settled to: real IDE, real display, reproducible on any machine with Docker, and observable — when a 15-minute test goes sideways, “read 40MB of idea.log” is a bad debugging story. We wanted to just look at the screen, and I confirm, an AI Agent can do that too!
In the MCP Steroid we combine approaches – there are fast and lightweight tests with the IntelliJ Platform SDK, and there are heavy docker-based integration tests to cover the most heavy end-to-end flows. We are discussing the second below.
Why Docker?
Since I want to stay as close as possible to end-user scenarios – a clean machine is required. We run MCP Steroid together with AI Agents such as Claude Code, Codex, and Gemini. I do not want my local machine setup to interfere with the actual integration test. That is where Docker comes in – every time, we run in the same scripted, clean environment.
Docker comes with the price – I can only integration-test my project with Linux. There are solutions like tart to run virtual macOS and other solutions on Windows, which I do not cover so far.
The image: heavy base, thin IDE layer
The Docker setup is two layers. A heavy ide-base image holds everything that changes rarely and caches
well; a thin per-IDE layer adds an IDE distribution on top. The base starts from a small Ubuntu image,
installs the X stack, and ends by dropping to a non-root user that does nothing (full Dockerfile):
FROM ubuntu:24.04

# X server, window manager, capture tools, fonts, and the JetBrains Runtime's native X deps
RUN apt-get update && \
    apt-get install -y --no-install-recommends \
        xvfb \
        x11-utils \
        fluxbox \
        fonts-dejavu \
        fonts-jetbrains-mono \
        ffmpeg \
        scrot \
        xdotool \
        xclip \
        xterm \
        libxi6 libxrender1 libxtst6 libxext6 libx11-6 \
        libfreetype6 libfontconfig1 \
        curl git unzip rsync procps ca-certificates \
        # … a few more utilities trimmed for the post
    && rm -rf /var/lib/apt/lists/*

# … plus six Temurin JDKs (8, 11, 17, 21, 24, 25) and Node.js 20, and the AI Agent CLIs
# (Claude Code, Codex, Gemini) behind a daily cache-bust ARG so they stay fresh

# a non-root user that owns the dotfiles and caches. ubuntu:24.04 already ships a
# default user at uid 1000, so free the slot before claiming it for `agent`.
RUN userdel -r ubuntu 2>/dev/null || true && useradd -m -u 1000 -s /bin/bash agent

USER agent
WORKDIR /home/agent
CMD ["sleep", "infinity"]
Every package earns its place:
xvfb— the virtual X server, our displayfluxbox— a tiny window manager; without one, IntelliJ windows have no position, no focus, no stackingx11-utils— gives usxdpyinfofor the display readiness probexdotool— window geometry and raw input injection from scriptsscrot+ffmpeg— screenshots and screen recordingfonts-jetbrains-mono,fonts-dejavu— an IDE without fonts renders as squares, not much to look at- the
libx*set — the JetBrains Runtime is a JVM with AWT; these are its native X client dependencies
The six JDKs let the IDE detect system JDKs and let tests exercise multi-version SDK selection; the daily cache-bust keeps the fast-moving agent CLIs fresh while the expensive apt layer rebuilds rarely. The same way you may need node, python, and other dev dependencies.
The last three lines matter more than they look. The container’s main process is literally sleep infinity —
the container is an empty, running room. Xvfb, the window manager, ffmpeg, the IDE itself — every real
process is started later, via docker exec, from the test harness. This is the single most useful design
decision in the whole setup: the harness owns the exact startup order, sees every process’s output
separately, can restart any piece, and cleanup is LIFO through one stack of dispose actions. A CMD that
tries to boot everything in a shell script gives you none of that.
The IDE layer is almost embarrassingly small (full Dockerfile), and potentially
cheap enough to run via docker exec or devrig:
ARG BASE_IMAGE=mcp-steroid-ide-base-test
FROM ${BASE_IMAGE}
USER root
COPY ide.tar.gz /tmp/ide.tar.gz
RUN mkdir -p /opt/idea && chmod a+rwx /opt && \
    tar -xzf /tmp/ide.tar.gz -C /opt/idea --strip-components=1 && \
    rm /tmp/ide.tar.gz
USER agent
ENV PATH="/opt/idea/bin:/usr/local/bin:/usr/bin:$PATH"
CMD ["sleep", "infinity"]
The ide.tar.gz is downloaded by the build on the host — the same resolver that powers
devrig backend download — and hard-linked into a hash-keyed build context, so Docker’s
BuildKit reuses the ~1.5 GB layer between runs instead of re-snapshotting it. PyCharm, GoLand, WebStorm,
Android Studio, and CLion get identical thin layers, only the archive and launcher name differ; Rider additionally
installs the .NET SDK.
Starting the container
The harness launches the container with plain docker run — no Testcontainers library right now.
I would recommend the Testcontainers library, since everything we do is similar and
should be supported there as well. We are considering moving to it later in the project too.
Here is the run command:
docker run -d --rm --init \
    --add-host=host.docker.internal:host-gateway \
    -v <run-dir>:/mcp-run-dir:rw \
    -v <repo-cache>:/repo-cache:ro \
    -v <m2-cache>:/home/agent/.m2:rw \
    -v <gradle-cache>:/home/agent/.gradle:rw \
    -p 6754 -p 8765 -p 5005 \
    <image-id>
The container command comes from the image’s CMD — that sleep infinity again. The Maven and Gradle cache
mounts persist dependency downloads between runs. Each -p publishes the container port to a random free
host port; the harness reads the mapping back and prints it, so parallel test runs never fight over ports.
Three published ports carry everything interesting:
| Port | Purpose |
|---|---|
| 6754 | MCP Steroid HTTP server inside the IDE — the test’s API |
| 8765 | video streaming dashboard — the part for humans |
| 5005 | JDWP — attach a debugger to the containerized IDE JVM |
That last one is worth a pause: the IDE inside the container runs with
-agentlib:jdwp=...,server=y,suspend=n, so when a test misbehaves you attach IntelliJ-on-the-host to
IntelliJ-in-the-container and step through the plugin code live. Debugging an IDE with an IDE — it never
stops being funny.
Two small flags carry weight. --init gives us a proper PID 1 that reaps zombie processes — with dozens of
docker exec sessions spawning Xvfb, ffmpeg, rsync loops and an entire JVM, orphans are guaranteed.
And we do not pass --user: the image bakes a non-root agent user (uid 1000 by default) that owns its dotfiles and
caches; overriding the uid from outside breaks fluxbox and Maven in creative ways. The host run directory is
made world-writable instead. Not elegant, works everywhere.
The X server: Xvfb, a readiness probe, and fluxbox
Everything display-related lives in a small driver before anything else runs. The startup is two commands and one wait loop (the display driver):
## Start the server
Xvfb :99 -screen 0 3840x2160x24 -ac

## Wait for it in the other session; poll until xdpyinfo succeeds
for i in $(seq 1 150); do
   xdpyinfo -display $DISPLAY >/dev/null 2>&1 && exit 0; sleep 0.1;
done; exit 1
Xvfb :99 -screen 0 3840x2160x24 -ac — a 4K virtual screen, 24-bit color, access control off (we are alone
inside the container). The readiness probe matters: Xvfb takes a moment to create its socket, and an IDE
launched a hair too early dies with a cryptic Can't connect to X11 display. Polling xdpyinfo until it
succeeds costs at most 15 seconds and removed a whole class of flaky starts. From here on, the harness stamps
DISPLAY=:99 onto every docker exec it issues, and that is the entire “installation” of the display
Then the window manager. You might think you can skip it — the X server renders fine without one. You can not. Without a WM, windows get no focus management, popups draw at 0,0, and IntelliJ’s own window activation logic quietly breaks. fluxbox is small, and is fully configured by writing three tiny dotfiles before launch (the window-manager setup):
## optional wallpaper — point it at your own image, or drop this line
printf 'background: fullscreen\nbackground.pixmap: /usr/share/images/mcp-steroid-wallpaper.jpg\n' > /home/agent/.fluxbox/overlay
printf 'session.screen0.toolbar.visible: false\n' > /home/agent/.fluxbox/init
printf '
    [app] (name=jetbrains-idea)
      [Decorations]  {NONE}
    [end]
    [app] (name=xterm)
      [Decorations]  {NONE}
    [end]
' > /home/agent/.fluxbox/apps

## Start it
fluxbox
After that, xdotool windowsize / windowmove pins the layout: the IDE takes the left two thirds of the 4K
screen, and an xterm on the right third tails the test’s own status output. When you watch the video
stream, that xterm is the running commentary of what the harness is doing to the IDE at that moment.
Managing IntelliJ inside the container
Getting IntelliJ to launch in Docker is easy. Getting it to reach a working editor with zero human clicks is where the real knowledge accumulated, one failure at a time. The launch itself is one line — the launcher script from the unpacked distribution, pointed at the project:
## make sure DISPLAY variable is set
DISPLAY=:99 /opt/idea/bin/idea /home/agent/project-home
That one line only survives because the IDE is fully prepared on disk before it runs. JDK pinning happens in
the factory as the project is deployed (intelliJ-factory.kt); the rest is startIde()
(intelliJ.kt), in this order:
- Pin the project and Gradle JDK in the project’s own
.idea/misc.xmland.idea/gradle.xml, so import picks the right JVM. - Create the folders — config, system, logs, plugins, and the project dir, so the IDE never races to create them.
- Write the consent files — the config-dir files and the JVM userPrefs that pre-accept EULA and privacy policy (more on these below).
- Write
trusted-paths.xml— mark the project path (and, for tests,/) as trusted, so the Trust Project dialog never appears. - Write the
.vmoptions— the full set of JVM flags (below). - Write
jdk.table.xml— pre-populate the JDK table for IntelliJ IDEA-family IDEs, so project-open Gradle sync resolves the JDK instead of stalling ~8 minutes on an unknown SDK.
Two of these carry most of the weight: the VM options and the consent files. Let’s look at each.
The VM options
Everything that keeps that launcher alive unattended is in the generated .vmoptions file. Its location is
special — <idea-home>.vmoptions, so for us /opt/idea.vmoptions. Here is the full set we generate:
-Xmx6g
-Xms1g

## Debugger is enabled, should we need it — it listens inside the Docker container
-agentlib:jdwp=transport=dt_socket,server=y,suspend=n,address=*:5005

## Redirect the IDE folders to explicit paths — enough to sandbox the IDE, even without Docker
-Didea.config.path=/mcp-run-dir/intellij/ide-config
-Didea.system.path=/home/agent/ide-system
-Didea.log.path=/mcp-run-dir/intellij/ide-log
-Didea.plugins.path=/home/agent/ide-plugins

## MCP Steroid plugin — bind on all interfaces so Docker can map the port out
-Dmcp.steroid.server.host=0.0.0.0
-Dmcp.steroid.server.port=6754
-Dmcp.steroid.dialog.killer.enabled=true
-Dmcp.steroid.updates.enabled=false
-Dmcp.steroid.analytics.enabled=false
-Dmcp.steroid.idea.description.enabled=false
-Dmcp.steroid.storage.path=/mcp-run-dir/intellij/mcp-steroid

## Suppress the AI promo window (it fetches a remote URL on first run and, in Docker,
## times out after 480s — an 8-minute startup deadlock). Also cut the network timeout.
-Dllm.show.ai.promotion.window.on.start=false
-Didea.connection.timeout=3000

## License server for commercial IDEs (Rider, etc.)
-DJETBRAINS_LICENSE_SERVER=https://your-intellij-linense-server-or-ide-services

## Skip EULA, consent dialogs, trust prompts, and onboarding
-Didea.trust.disabled=true
-Djb.consents.confirmation.enabled=false
-Djb.privacy.policy.text=<!--999.999-->
-Djb.privacy.policy.ai.assistant.text=<!--999.999-->
-Dmarketplace.eula.reviewed.and.accepted=true
-Dwriterside.eula.reviewed.and.accepted=true
-Didea.initially.ask.config=never
-Dide.newUsersOnboarding=false
-Dnosplash=true

## Belt-and-suspenders vs the SDK-download consent modal that blocks JPS builds
-Dunknown.sdk=false
-Dunknown.sdk.auto=false
-Dunknown.sdk.modal.jps=false

## Never talk to the outside world about updates or telemetry
-Didea.suppress.statistics.report=true
-Didea.local.statistics.without.report=true
-Dfeature.usage.event.log.send.on.ide.close=false
-Dide.enable.notification.trace.data.sharing=false
-Didea.updates.url=http://127.0.0.1
-Dide.no.platform.update=true
-Dide.browser.disabled=true
Each of those trust/consent/onboarding flags is necessary to avoid a modal dialog on the first start.
The good news – it works now, and it is a solvable grind.
My favorite: the AI promo window that appears on a
fresh IDE once made startup deadlock for a full eight minutes inside Docker before we found
llm.show.ai.promotion.window.on.start=false. The unknown.sdk trio is a close second — a background build
task deciding it wants to download a JDK, and asking for consent with a modal, on a machine with no human.
A dialog nobody can click is a distributed systems problem now. And because every IDE release can add a new
first-run popup, the plugin ships an active dialog killer as the last line of defense.
Config, logs, and system dirs are split deliberately: config and logs live on the bind-mounted run
directory, so after a failed CI run you get the full idea.log and the exact IDE config as artifacts. The
system dir (caches, indexes) stays on the container filesystem, where it is fast and disposable. The MCP
Steroid plugin ZIP is unpacked into the plugins dir before launch, and a floating license server is
configured via -DJETBRAINS_LICENSE_SERVER so commercial IDEs like Rider skip the license dialog too —
ours points at an internal JetBrains server, you would bring your own here.
The consent files
VM options cover most of the first-run popups, but not all. A few consents live in files the IDE reads
before any option is applied, so we write those ourselves before launch. IntelliJ records EULA and
privacy-policy acceptance both in the config dir and in the JVM user preferences under the home directory;
we pre-write them with a version far in the future (999.999) so the IDE always thinks the latest terms
are already accepted:
# inside the IDE config dir
options/other.xml
early-access-registry.txt
options/AIOnboardingPromoWindowAdvisor.xml

# inside the agent home (JVM userPrefs + consent options)
.java/.userPrefs/jetbrains/prefs.xml
.java/.userPrefs/jetbrains/privacy_policy/prefs.xml
.config/JetBrains/consentOptions/accepted
The user-prefs files carry the future version — accepted_version=999.999,
privacy_policy_accepted_version=999.999, eua_accepted_version=999.999, and so on — while the config-dir
files switch off onboarding and the AI-promo window, and consentOptions/accepted records the
usage-statistics choice. The exact list (there are a couple more, including an encoded Java-prefs path) is in
IdeStartupConfig.kt. It is not glamorous, but it is the difference between a clean start
and an IDE waiting on a dialog nobody will ever click.
With all of that written to disk, we finally run the launcher — and now we wait.
Waiting for IntelliJ to be ready
Since MCP Steroid is already a tool to access IDE internals, we use the tool itself to monitor IDE readiness, for that we pass the following steps:
- poll the MCP Steroid port until it answers, then wait for the IDE window
- register the JDKs in the IDE (essential for IntelliJ IDEA-based tools)
- set the project SDK
- trigger the Maven/Gradle import and wait for it to actually finish
- wait for indexing and background progress to settle
- resolve any remaining unknown SDKs
The first step is a plain poll — curl the MCP port until it answers, while failing fast if
the IDE process dies or the log shows a startup failure (mcp-steroid.kt). Every step after that is a Kotlin snippet
we send through the steroid_execute_code tool, which runs it inside the live IDE. Setting the project
SDK, for example, is just the IntelliJ API (mcp-steroid-jdks.kt):
// runs inside the live IDE via steroid_execute_code
val sdk = ProjectJdkTable.getInstance()
    .getSdksOfType(JavaSdk.getInstance())
    .first { it.name == "21" || it.name == "temurin-21" || it.name == "corretto-21" }
edtWriteAction { JavaSdkUtil.applyJdkToProject(project, sdk) }
Triggering the import and, crucially, waiting for it to finish is the same idea — subscribe to
ProjectDataImportListener (Gradle) or MavenImportListener (Maven), fire the refresh, and await
the finished event instead of a blind sleep. The last step waits for Observation.awaitConfiguration
to drain, then for the IDE to reach smart mode with zero running background progress indicators, held for
several quiet rounds — indexing arrives in waves as libraries and their sources download, so a one-shot
check returns too early. It also fails fast if progress freezes, so a stuck import does not hang to the
timeout. The import and settle logic is in mcp-steroid-import.kt.
The end-user AI/Dev experience in the MCP Steroid project
An integration test must be designed to start from the IDE as a usual test.
I’ve seen many integration tests that were hard to start locally and only ever ran on CI. That makes them unique, and maintained only by their authors. With Agentic AI and coding agents we can’t afford that price – each test run must be as cheap and as fast as possible, because our AI Agents will call such tests many times.
From an AI Agent’s (or a developer’s) point of view, the whole machinery above collapses into one call:
@Test
@Timeout(value = 15, unit = TimeUnit.MINUTES)
fun `container starts and IDE becomes ready`() = runWithCloseableStack { lifetime ->
    IntelliJContainer.create(lifetime, IntelliJContainerOpts(consoleTitle = "ide-container"))
}
IntelliJContainer.create (intelliJ-factory.kt) builds the image, starts the
container, brings up Xvfb → fluxbox → video → screenshots → xterm, deploys the plugin and the test project,
launches the IDE, and blocks in waitForMcpReady(). That gets the IDE and the MCP server up; a test that
needs a fully imported project calls waitForProjectReady() next — the JDK/import/indexing steps from above.
The lifetime stack unwinds all of it in reverse order — ffmpeg gets its SIGINT before
the container goes away, so the video file always has a valid trailer. After that, tests speak plain MCP over
HTTP: steroid_execute_code runs Kotlin inside the live IDE, steroid_list_windows reports which dialogs
are showing and whether indexing is in progress, steroid_take_screenshot returns what the agent sees.
Sending the live video to a browser tab
Now the fun part. Running an integration test with GUI version of an IDE. Are you curious to see what’s inside?
Screenshots came first — a scrot loop drops one PNG per second into the mounted volume,
and that alone made failures debuggable. But flipping through PNG files is archaeology. During long agent
runs we wanted to watch, live, like over a colleague’s shoulder.
The obvious answer is VNC, and we deliberately skipped it. VNC means a VNC server in the container, a client on every developer machine, one more port, one more password. Our real requirement was much weaker: one-directional, view-only, zero-install. Something a browser tab can show.
So the pipeline is: ffmpeg grabs the X display into a growing fragmented MP4 file, and a tiny Node.js
server streams that file into a <video> tag as it grows. No VNC, no WebRTC, no websockets — HTTP chunked
transfer, invented last century, works great.
The capture side (the capture + streaming driver) — 24 fps, and a keyframe every second
(-g 24), which is load-bearing, as we will see:
ffmpeg -nostdin -y \
    -f x11grab -video_size 3840x2160 -framerate 24 -i :99 \
    -c:v libx264 -preset ultrafast -tune zerolatency -crf 28 \
    -pix_fmt yuv420p -r 24 \
    -g 24 -keyint_min 24 \
    -x264-params keyint=24:min-keyint=24:scenecut=0:rc-lookahead=0 \
    -movflags frag_keyframe+empty_moov+default_base_moof \
    -frag_duration 1000000 \
    -flush_packets 1 -fflags +flush_packets \
    /tmp/video/recording.mp4
Three details here cost us real debugging days, so read them as a checklist:
-movflags frag_keyframe+empty_moovturns the output into a fragmented MP4. A normal MP4 writes its index (themoovatom) at the end, when encoding finishes — useless for a file you want to play while it is being written. Fragmented MP4 is self-describing from the first fragment.- The keyframe interval must be forced down. x264’s default is one keyframe per ~250 frames, and each
fragment starts on a keyframe — so the browser would sit on a black screen 20–50 seconds waiting for the
first fragment to complete.
keyint=24(one second) makes playback start almost immediately. We set both the generic-goption and x264’s ownkeyintparams, so the encoder and the muxer agree on one-second fragments. - ffmpeg writes to a container-local path, not the mounted volume. Docker Desktop’s virtiofs does not
flush file data to the host while the writing process keeps the file open — the host sees a zero-byte
file for the entire recording. So ffmpeg writes to
/tmpinside the container, and a one-secondrsync --inplaceloop mirrors the growing file to the mounted volume. Closed files (like the scrot PNGs) flush fine; it is specifically the always-open file that bites. The streaming server below reads the same container-local file — the rsync copy exists only so the host keeps the recording as an artifact.
The serving side is a few hundred lines of Node.js baked into the image, more than half of it the dashboard page (video-server.js). The tail-follow core is under a hundred lines: keep the HTTP response open, remember a byte position, and every ~100 ms send whatever the file grew by (slightly simplified here):
// GET /video.mp4 — stream the growing file with chunked transfer encoding
function serveVideo(req, res) {
    res.writeHead(200, { 'Content-Type': 'video/mp4', 'Connection': 'keep-alive' });
    let position = 0;
    const scheduleNext = (ms) => setTimeout(sendChunk, ms);

    function sendChunk() {
        if (res.destroyed) return;
        const stat = getVideoStat();
        if (!stat) { scheduleNext(100); return; }

        if (stat.size > position) {
            const stream = fs.createReadStream(VIDEO_FILE, { start: position, end: stat.size - 1 });
            stream.on('data', (chunk) => { if (!res.destroyed) res.write(chunk); });
            stream.on('end', () => { position = stat.size; scheduleNext(75); });
        } else {
            scheduleNext(100);
        }
    }
    sendChunk();
}
GET / serves a small dashboard page — a full-viewport <video autoplay muted playsinline> element pointed
at /video.mp4, the run ID in the header, and a status dot polling GET /status every 300 ms. When the
harness shuts the server down, the page notices — repeated /status failures flip the dot to “stopped” and
the tab closes itself. On the host side, the harness waits for /status to answer and runs
open http://localhost:<mapped-8765>/ — on macOS the tab appears by itself the moment the stream is alive.
On other platforms you follow the VIDEO_DASHBOARD= line from session-info.txt in the run directory,
it is printed to the test output too:
waitFor(35_000L, "Video streaming server ready") {
    curl("$dashboardUrl/status").httpCode == 200
}
if (isMacOs) ProcessBuilder("open", dashboardUrl).start()
One browser caveat we learned the embarrassing way while recording the demo: Safari refused to play the growing fragmented MP4 — it waited for the first frame forever, Chrome handled the same stream fine. If you build this, test in Chrome first and save yourself an hour of blaming the encoder.
The latency of the whole chain — X11 frame to browser pixel — comes to a couple of seconds in our runs. For “is the agent stuck on a dialog or actually indexing”, that is more than enough.
The same pipeline, on camera
The demo video at the top of this post is this exact infrastructure, filmed. It runs the pipeline one level deeper: a macOS VM (via Tart) runs IntelliJ, which runs the integration test from the gutter, which boots the Docker container with the inner IDE, and Chrome pops up with the live dashboard streaming that inner IDE while a Claude agent drives its debugger. An IDE in a container inside a VM, watched from a browser tab — and every layer is exactly the code above.
Producing a readable video needed only three small overrides on top of the stock pipeline: the inner
display drops from 4K to 1280×720 (so IDE fonts map ~1:1 onto video pixels), CRF goes from 28 to 20, and the
x264 preset from ultrafast to veryfast. The demo checkout carries a small local patch that reads these
from environment variables — candidates to land on main as proper knobs, not there yet. Upstream CI still
runs the defaults: same code path exercised daily, slightly nicer pixels for the camera.
Re-implementing this for your own GUI tests
Nothing above is IntelliJ-specific. The recipe, condensed:
- Base image: Debian/Ubuntu +
xvfb, a small WM (fluxbox),x11-utils,xdotool,scrot,ffmpeg, fonts, and your app’s native GUI libraries. End it withCMD ["sleep", "infinity"]. - Own the startup order from the outside. Start Xvfb via
docker exec, pollxdpyinfountil the display answers, then the WM, then capture, then your application. Register cleanups in reverse. - Disarm every first-run dialog your application can show. Hunt them down one by one; each is a hang in CI. Budget real time for this — it took us the longest.
- Health-check with fail-fast branches: process alive, log clean, endpoint answering. Never poll for success alone.
- Screenshots first (
scrotin a loop — trivial and already saves you), video second: ffmpegx11grab→ fragmented MP4 with 1-second keyframes → tail-follow HTTP server →<video>tag. Write to a container-local path and rsync to the volume if you are on Docker Desktop. - Publish three ports: your app’s API, the video dashboard, and a debugger.
We drive all of this from Kotlin, but it is nothing a shell script can’t do. The whole sequence, wired
together — the two background loops (scrot, rsync) are the ones the sections above only described:
set -euo pipefail
cid=$(docker run -d --rm --init -p 8765 my-gui-image)   # the "sleep infinity" room
x() { docker exec -e DISPLAY=:99 "$cid" "$@"; }          # every command carries DISPLAY
x mkdir -p /tmp/video /tmp/shots

x Xvfb :99 -screen 0 1280x720x24 -ac &                   # 1. virtual display
x bash -c 'for i in $(seq 1 150); do xdpyinfo -display :99 >/dev/null 2>&1 && exit 0; sleep 0.1; done; exit 1'
x fluxbox &                                              # 2. window manager
x xclock &                                               # 3. your GUI app (stand-in here)
x bash -c 'while :; do scrot /tmp/shots/$(date +%s).png; sleep 1; done' &   # screenshots
x ffmpeg -f x11grab -video_size 1280x720 -framerate 24 -i :99 \
    -c:v libx264 -preset ultrafast -tune zerolatency -crf 28 -pix_fmt yuv420p \
    -g 24 -keyint_min 24 -x264-params keyint=24:min-keyint=24:scenecut=0:rc-lookahead=0 \
    -movflags frag_keyframe+empty_moov+default_base_moof -frag_duration 1000000 \
    -flush_packets 1 -fflags +flush_packets /tmp/video/recording.mp4 &   # 4. capture
x bash -c 'while :; do rsync --inplace /tmp/video/recording.mp4 /mcp-run-dir/; sleep 1; done' &
x node /usr/local/bin/video-server.js /tmp/video/recording.mp4 8765 &   # 5. stream
open "http://localhost:$(docker port "$cid" 8765/tcp | cut -d: -f2)/"        # 6. watch
The parts I would warn you about, honestly: the vmoptions dialog-hunting never truly ends — every IDE
release can add a new first-run popup, and we find out when CI hangs. The 4K Xvfb display makes ffmpeg eat a
steady chunk of CPU; on weak CI workers you may want 1080p. And the whole docker exec orchestration is more
code than a docker-compose file — the flexibility is worth it for us, but it is a real trade-off.
Try it, steal it, improve it
Everything in this post is in the open jonnyzzz/mcp-steroid repository — the base and agent Dockerfiles, the X server driver, the video pipeline, and the video-server.js you can lift wholesale into your own project. To see it live:
./gradlew :test-integration:test --tests '*IntelliJContainerTest.container starts and IDE becomes ready'
On macOS a browser tab opens by itself on a live IDE booting inside a container; elsewhere, follow the
VIDEO_DASHBOARD= URL from session-info.txt in the run directory.
If you build a variant of this for your own GUI testing — a different app, a different streaming trick, or you got WebRTC working where we settled for chunked HTTP — I genuinely want to hear about it. Tell me on LinkedIn or Twitter, or open an issue on the repo. And if the demo video is what brought you here: that is this same pipeline, just pointed at a camera.